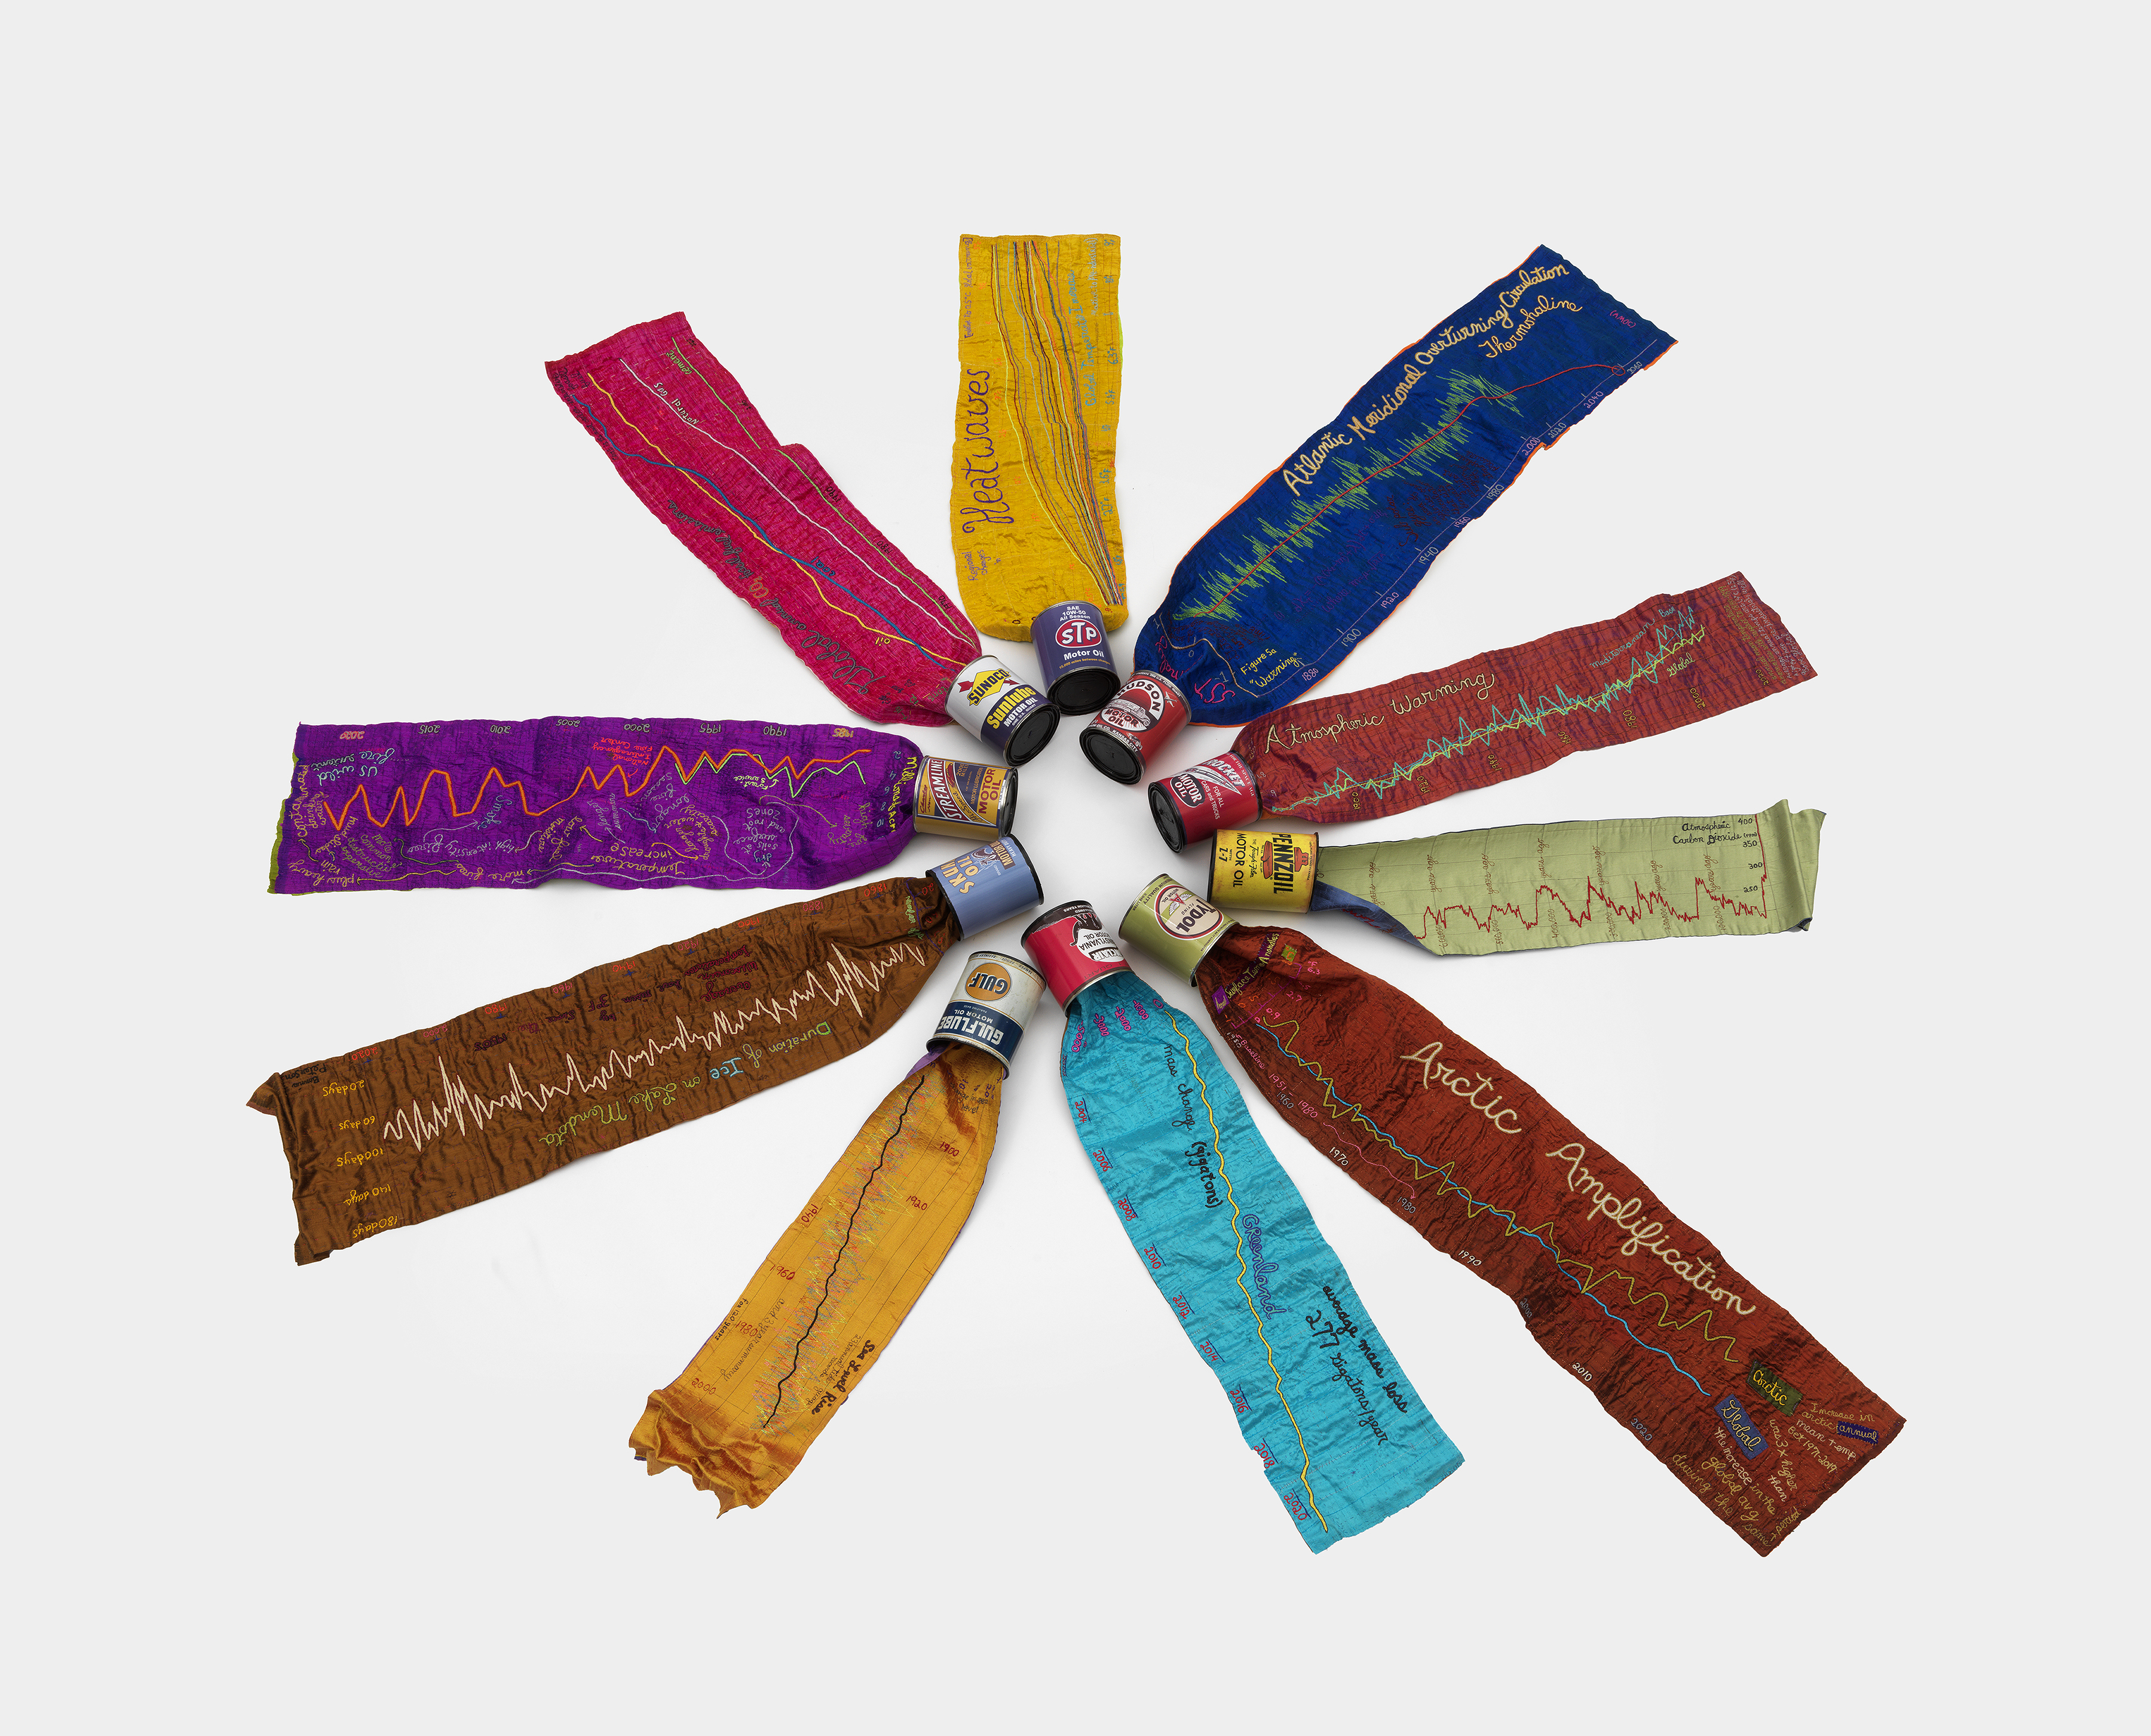
Starting
at the center top (12:00 position) and going clockwise:
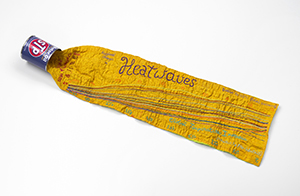
Yellow graph: Heatwaves
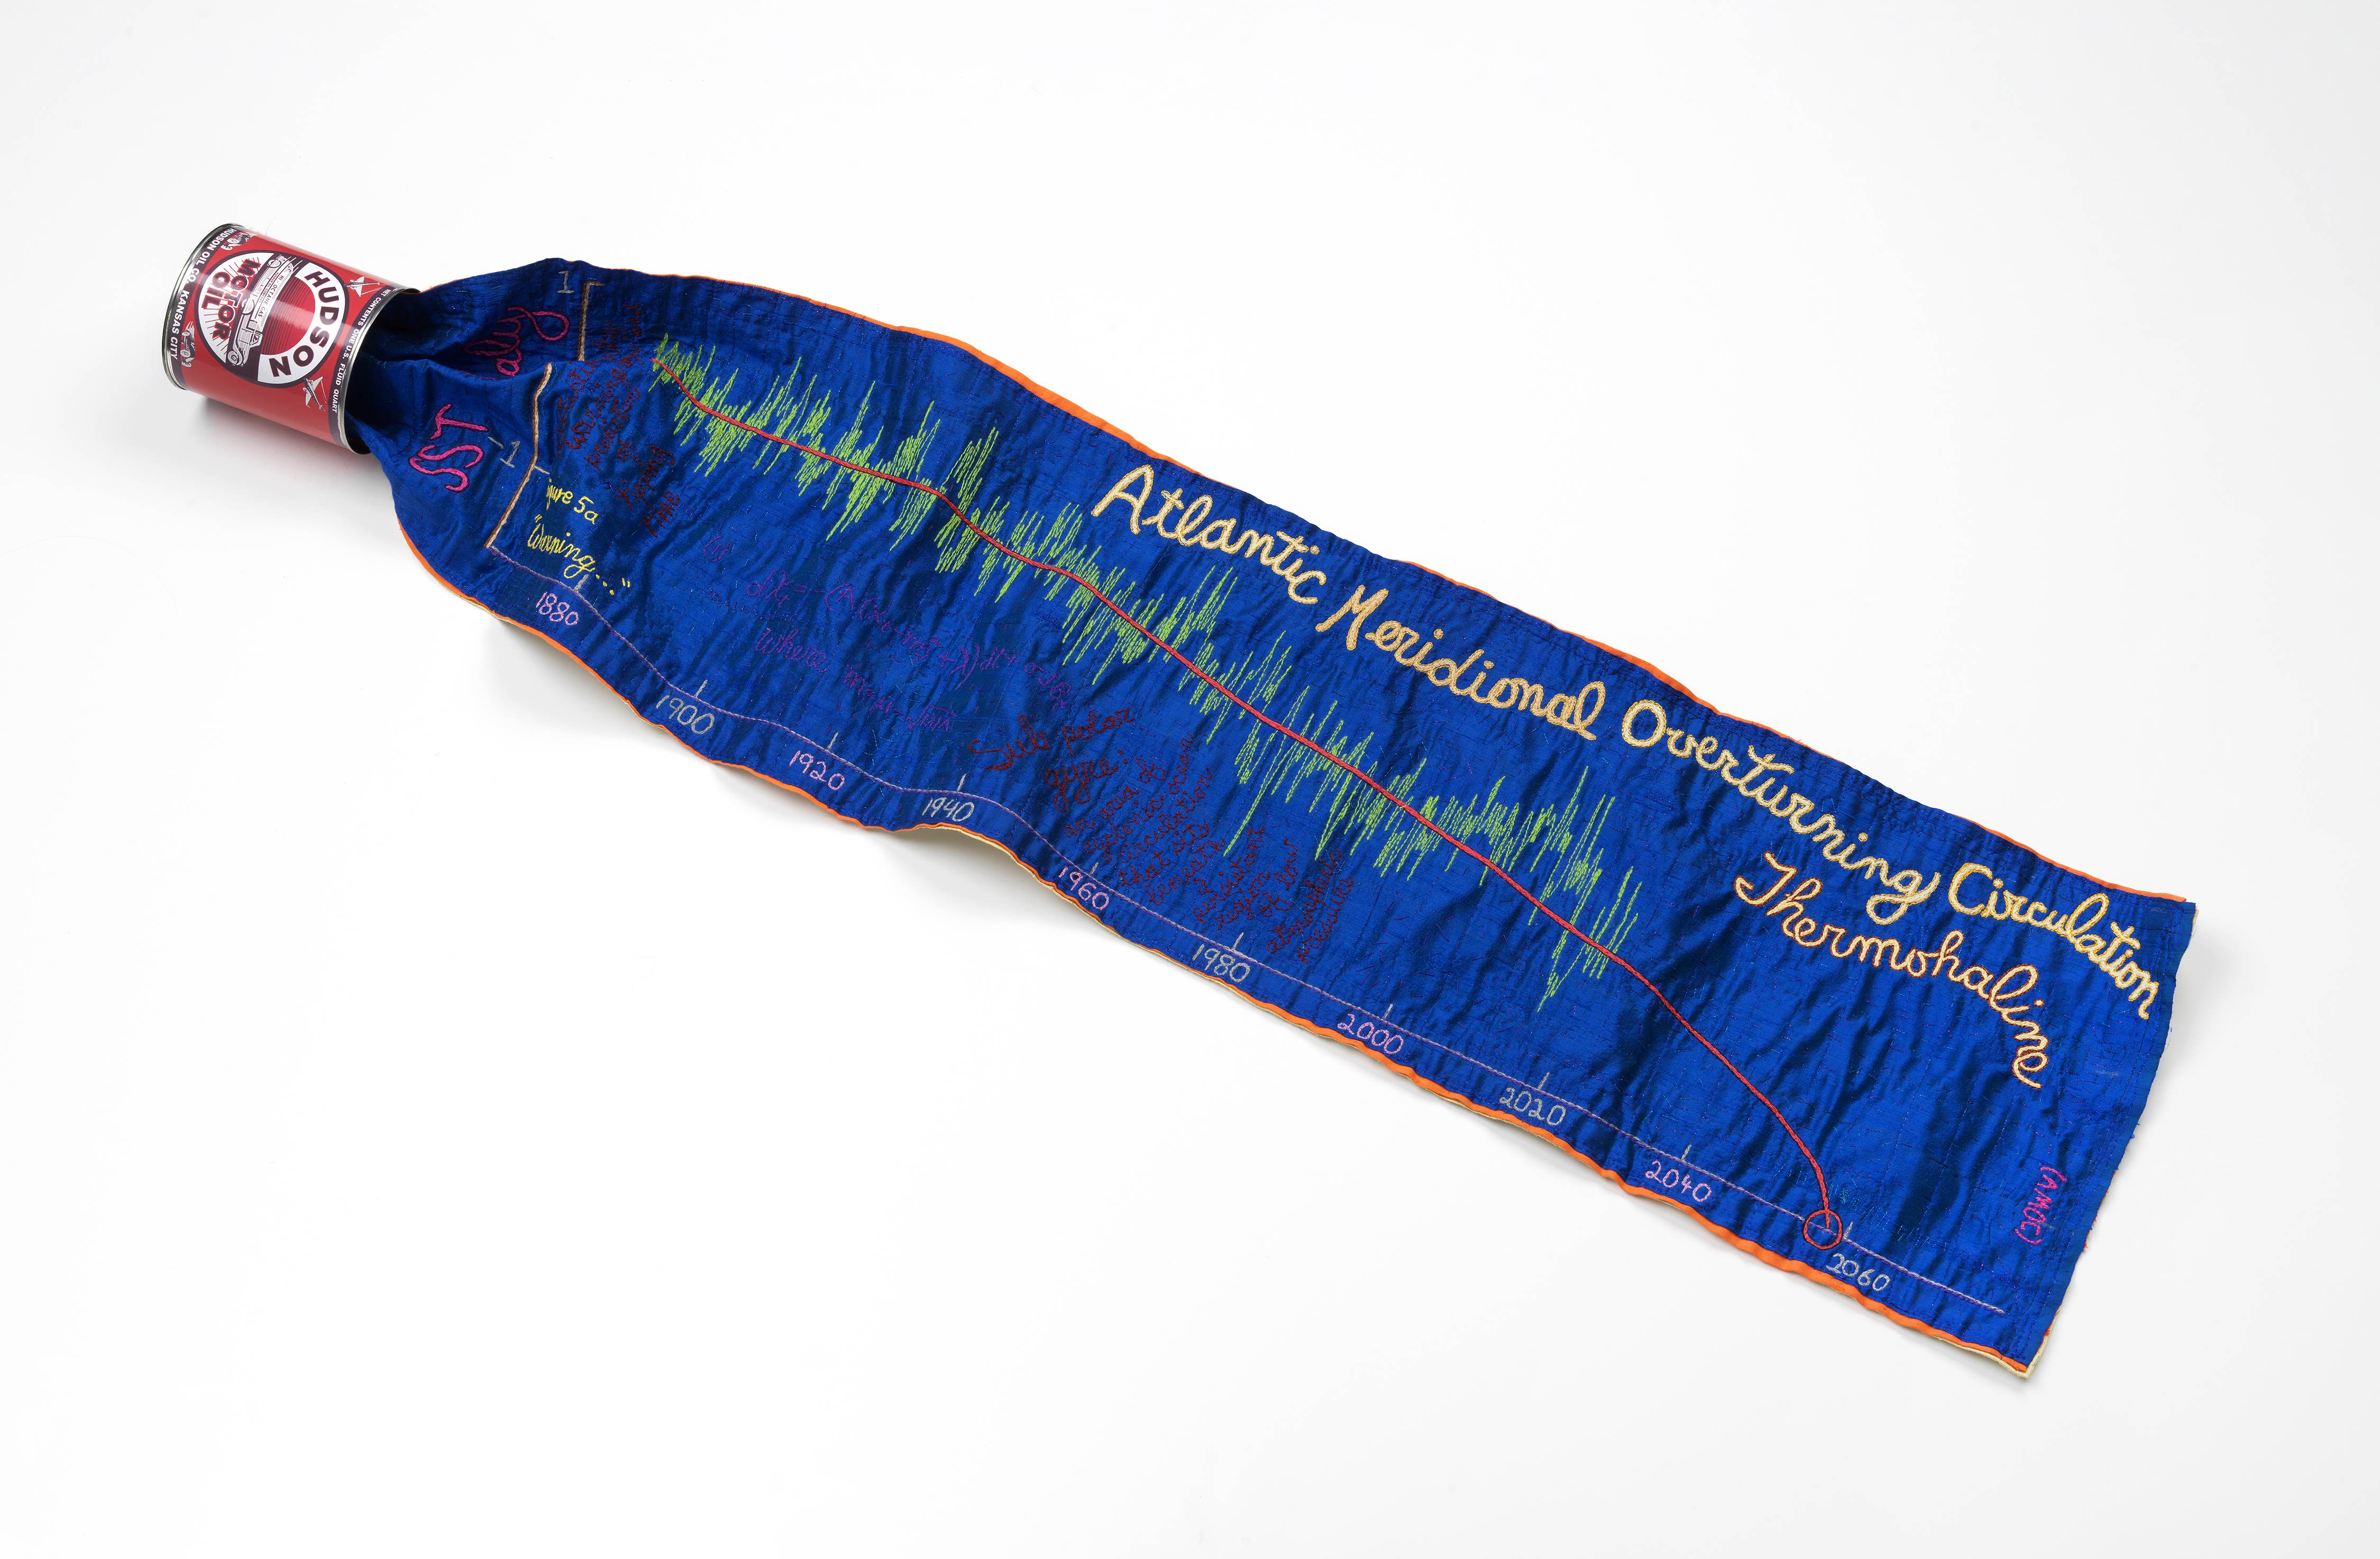
Dark blue: collapse of the Atlantic Meridional Overturning Circulation
Thermohaline (AMOC)
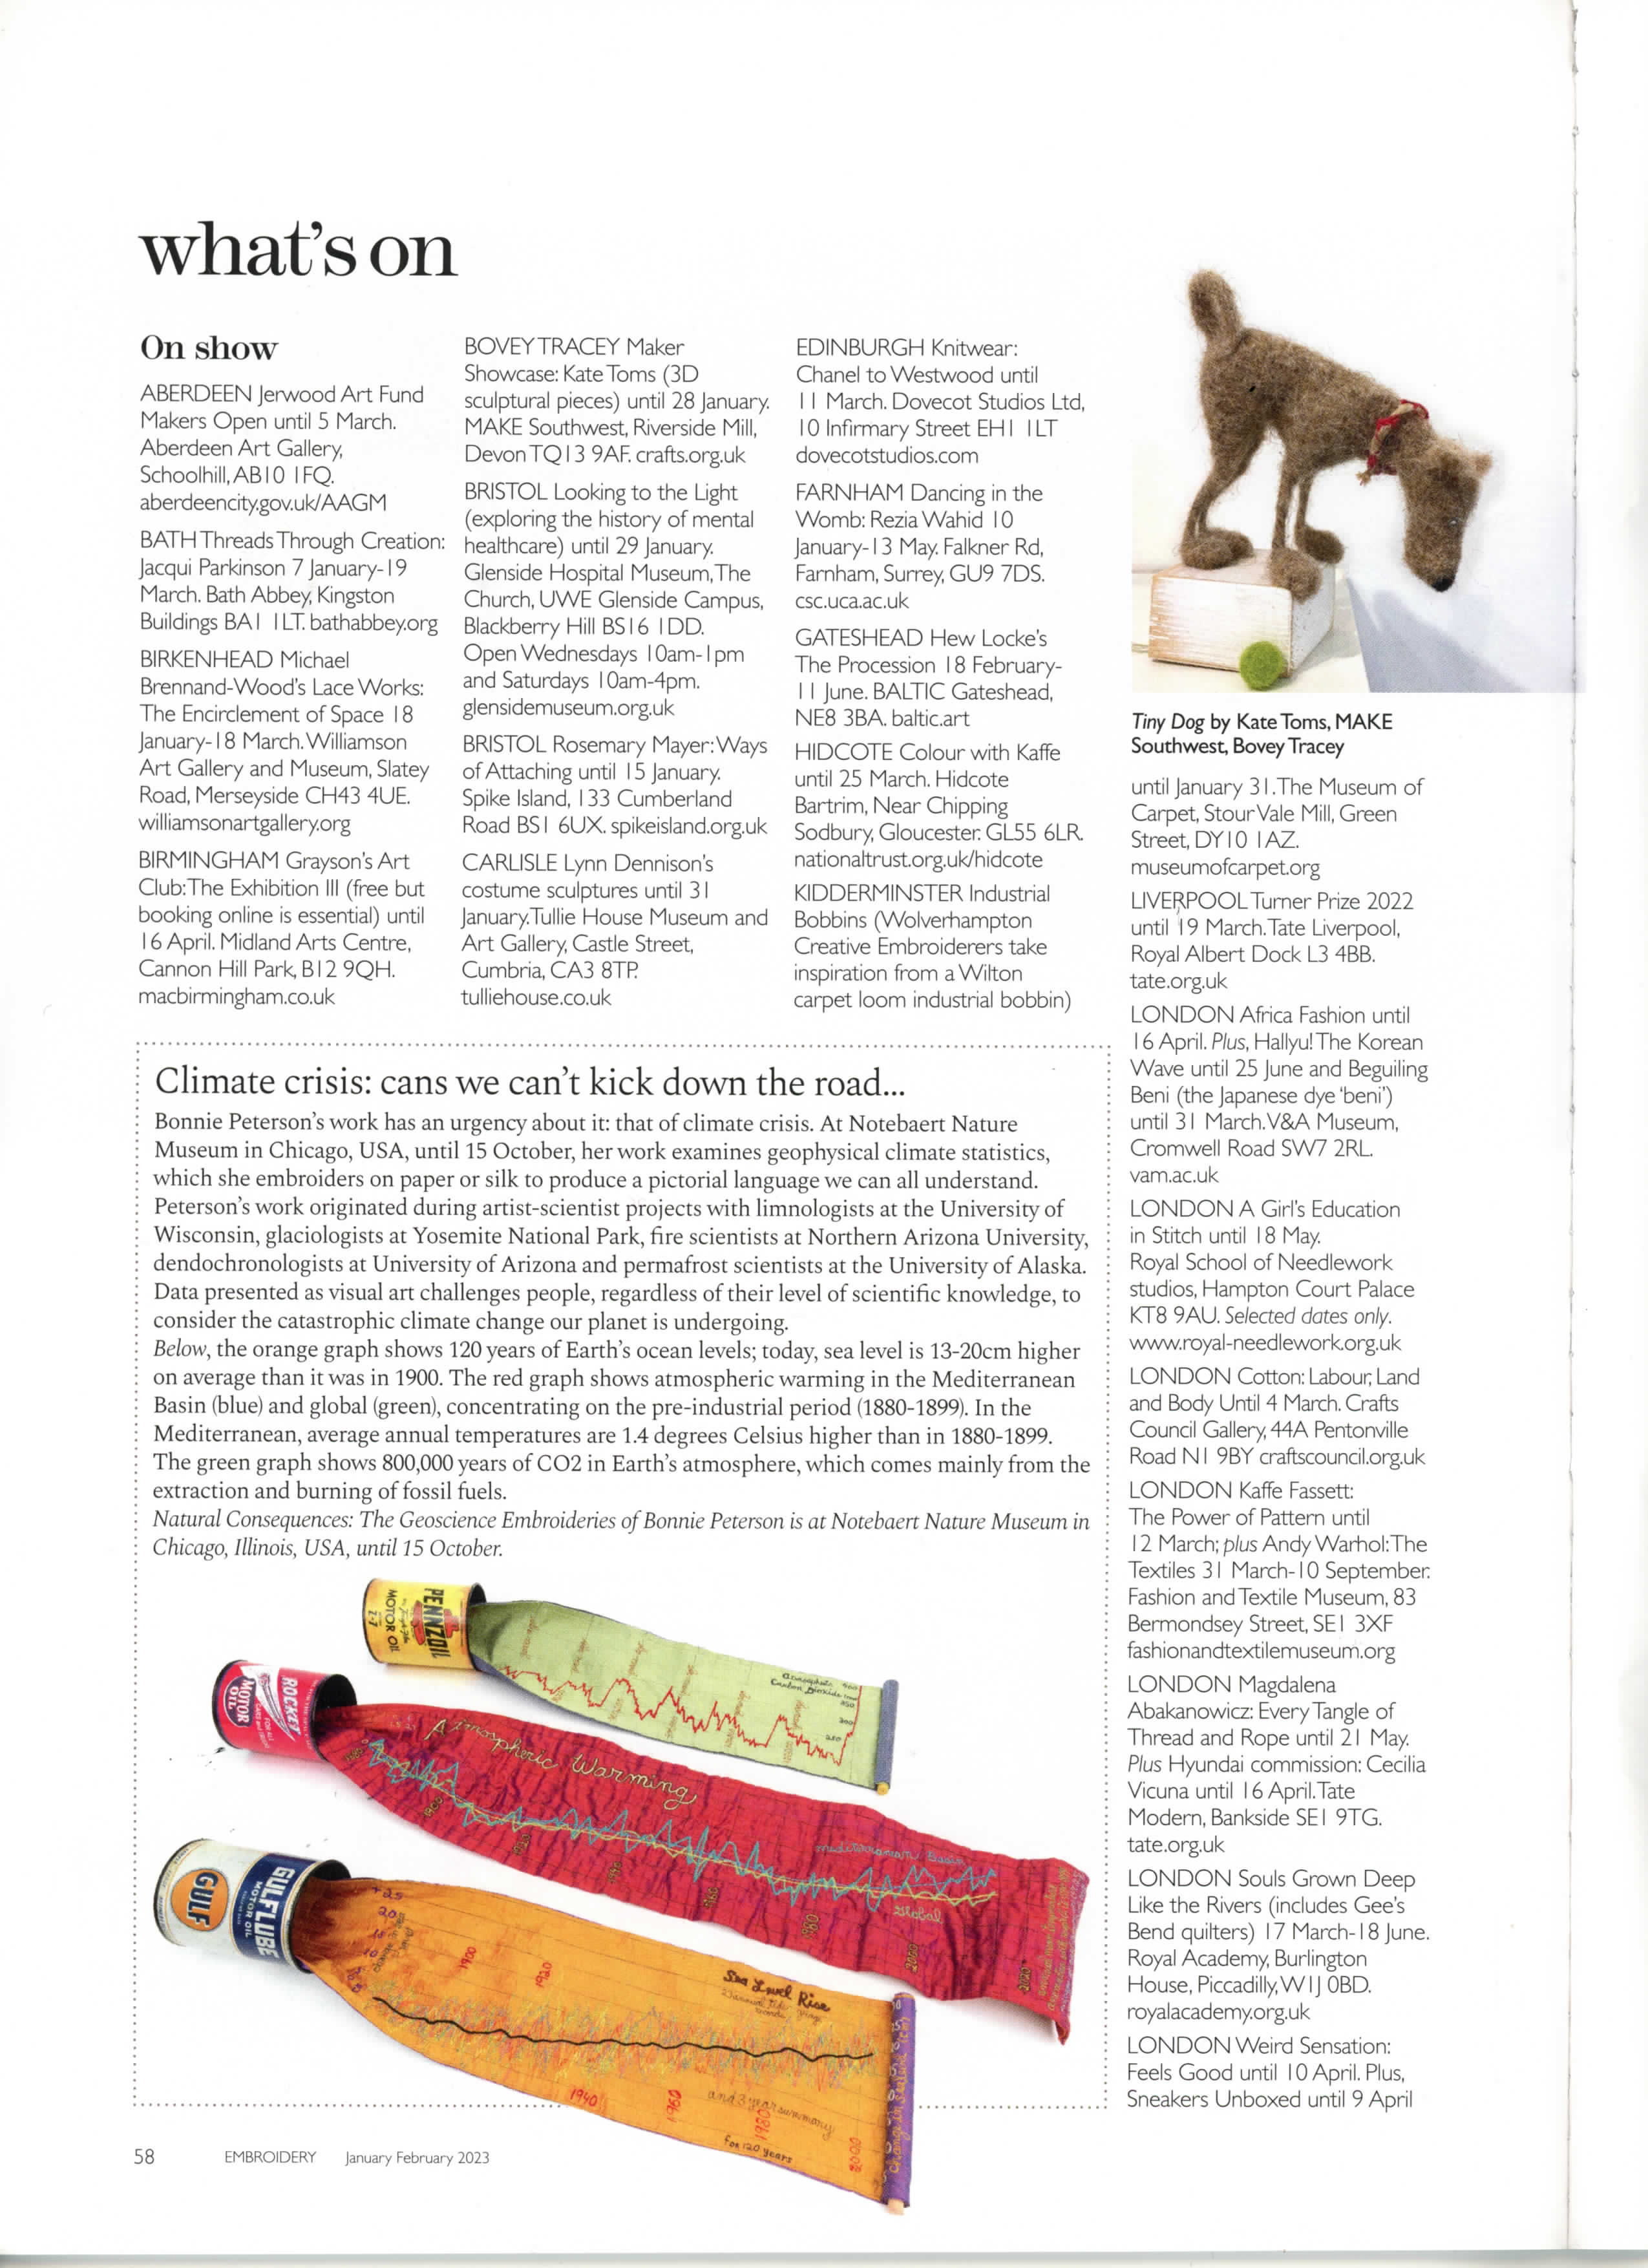
Dark Red: Atmospheric Warming
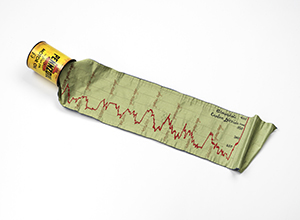
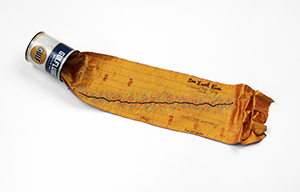
Green graph is 800,000 years of CO2 in Earth's atmosphere
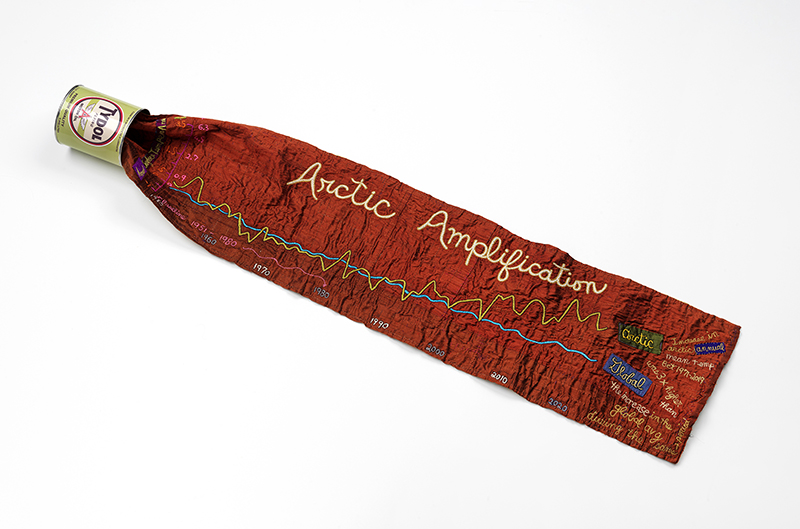
Bright red: Arctic Amplification
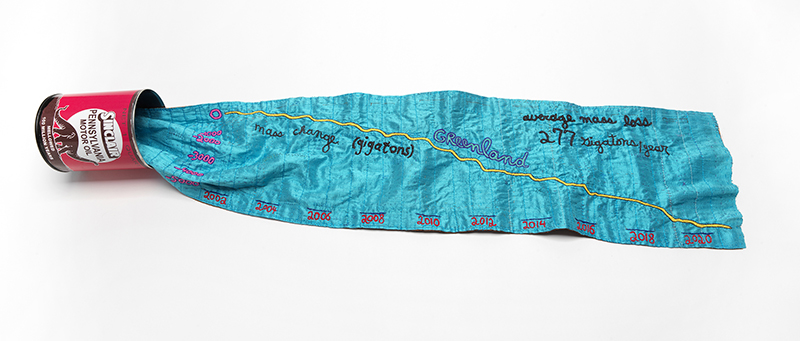
Light blue: mass loss of the Greenland ice sheet.
Orange: Sea Level Rise
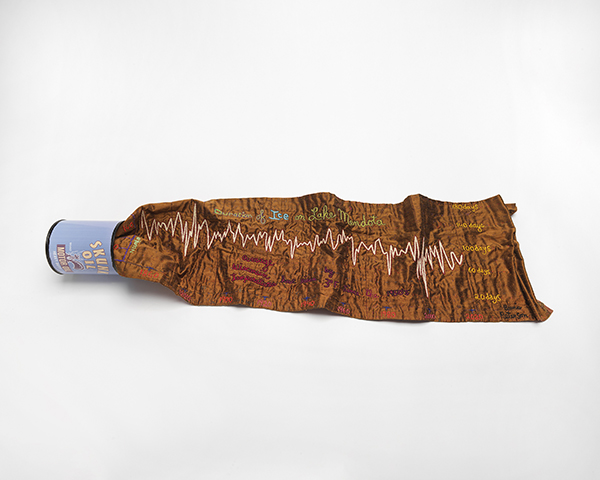
Brown: duration of ice on Lake Mendota in Madison, WI
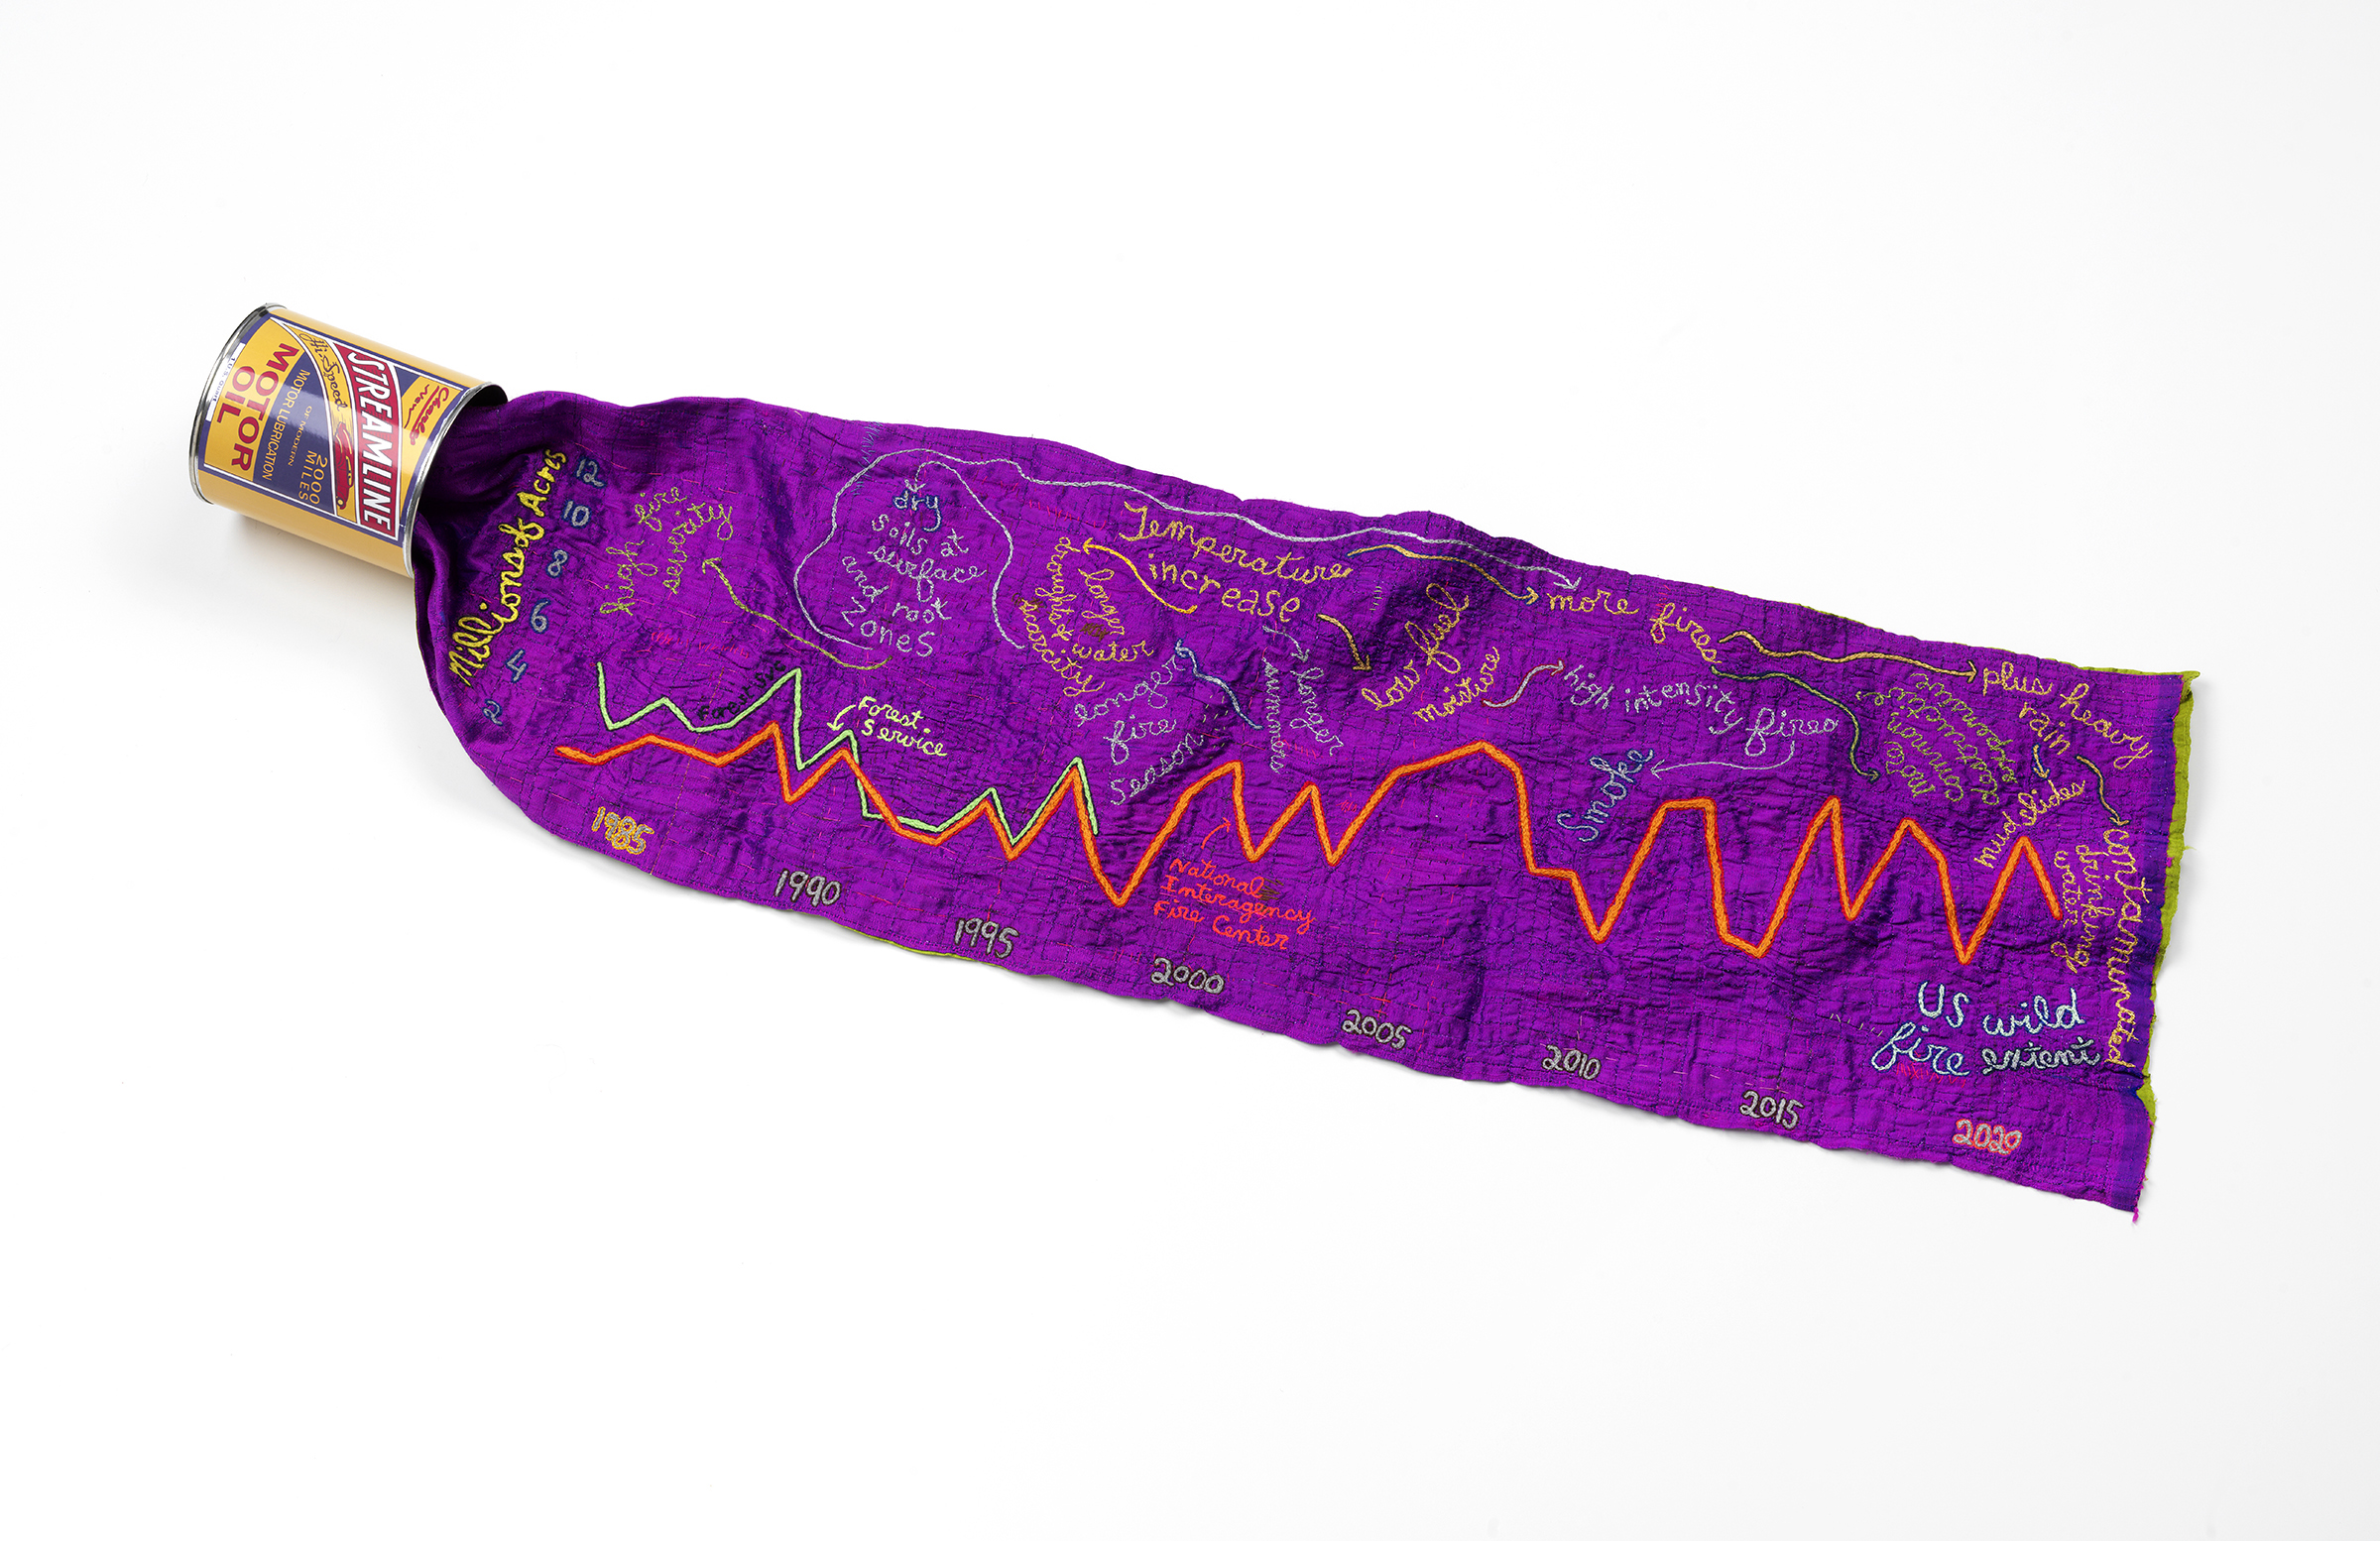
Purple: Fire Acres Burned
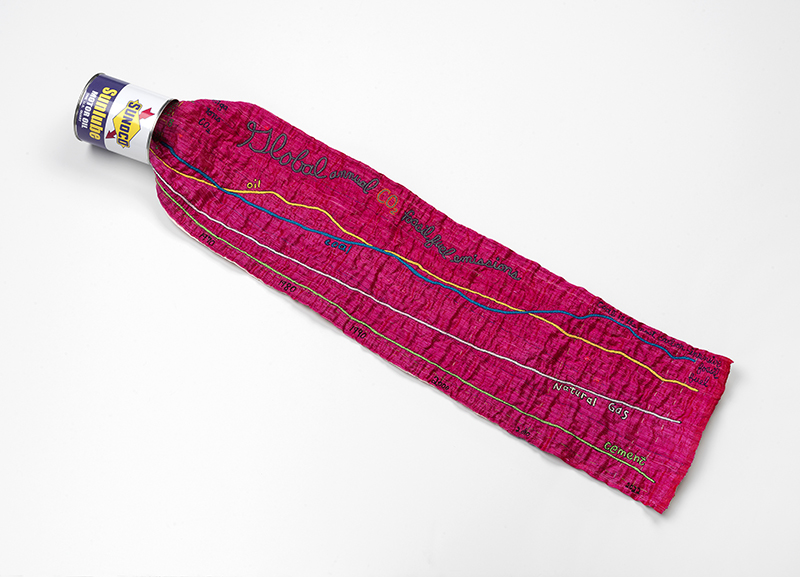
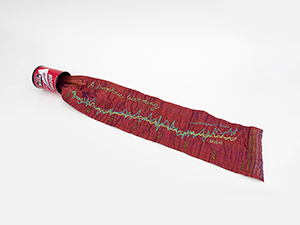
Pink: Global Annual CO2 Fossil Fuel Emissions
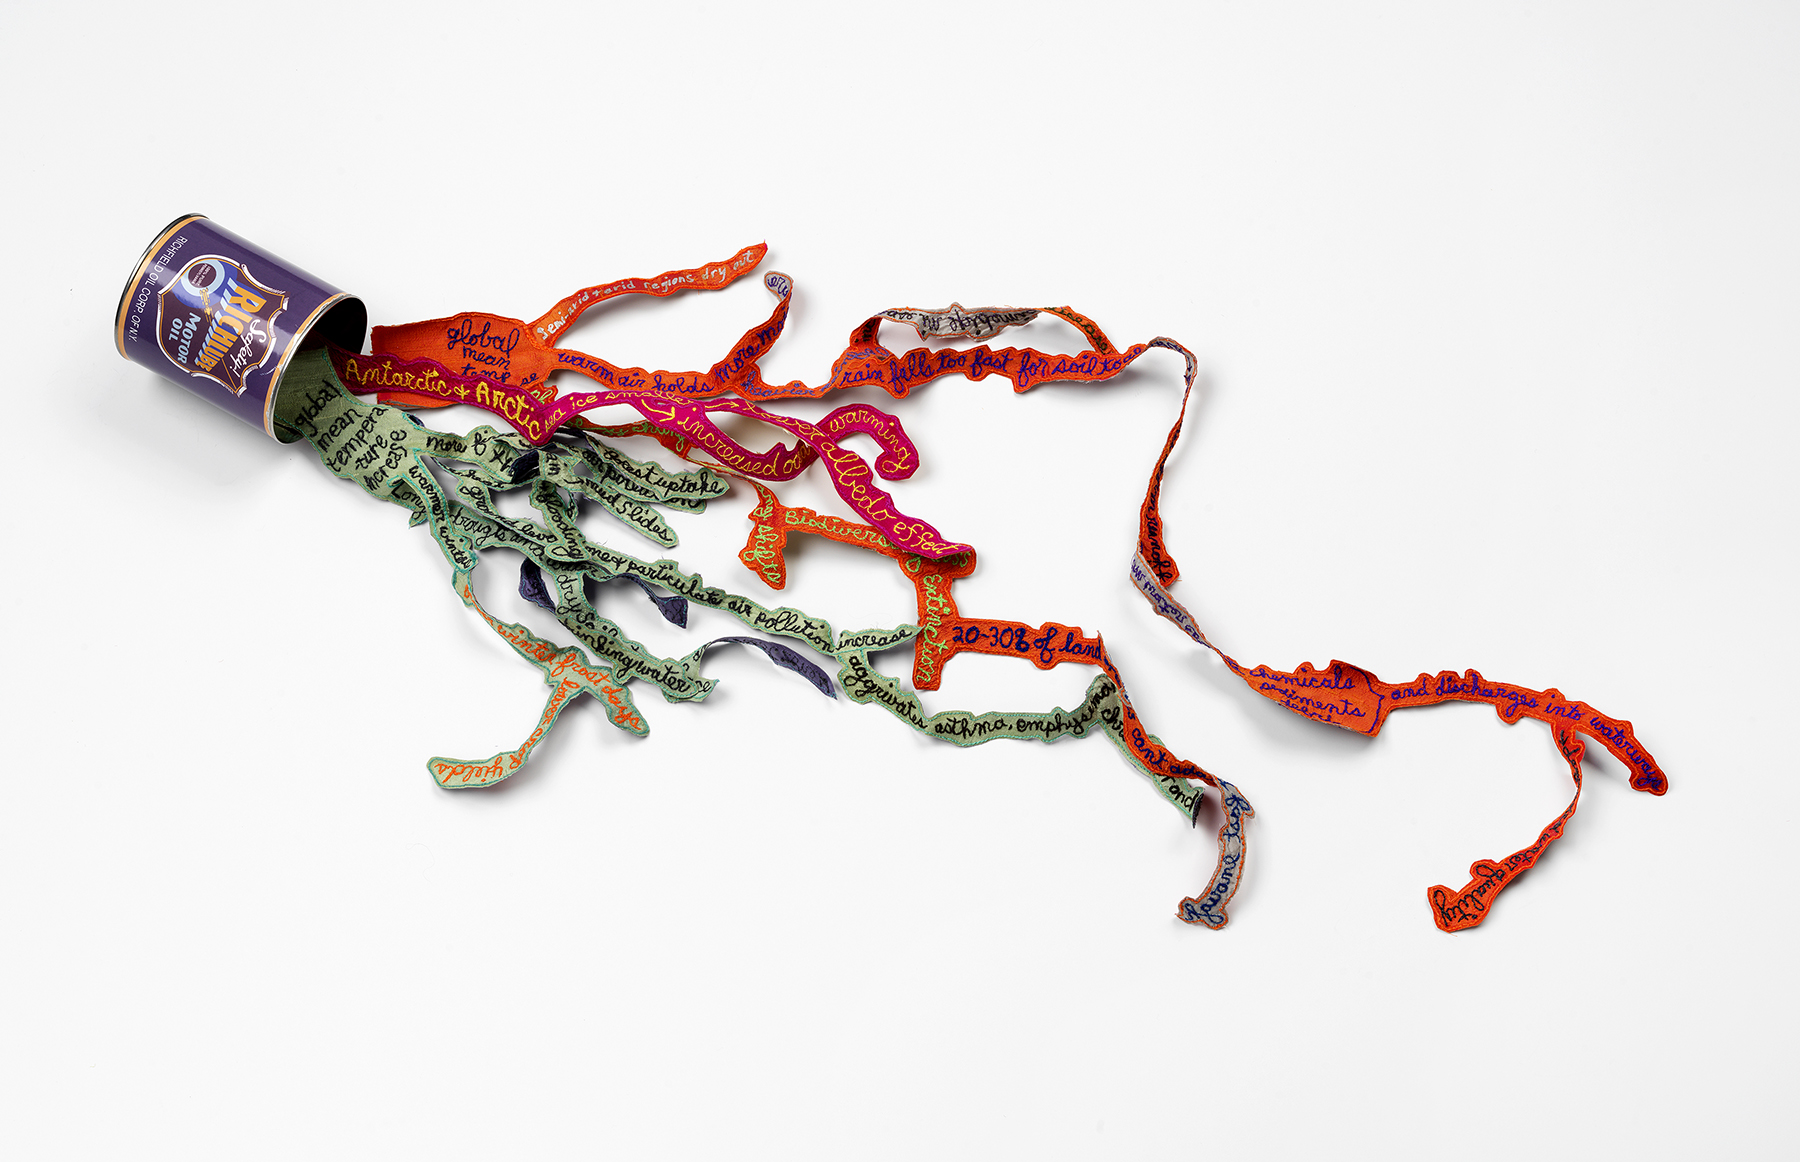
The Spider Web entanglement: Climate
Consequences